


Price Action in Forex Markets: What Charts Really Say
It was around London open.
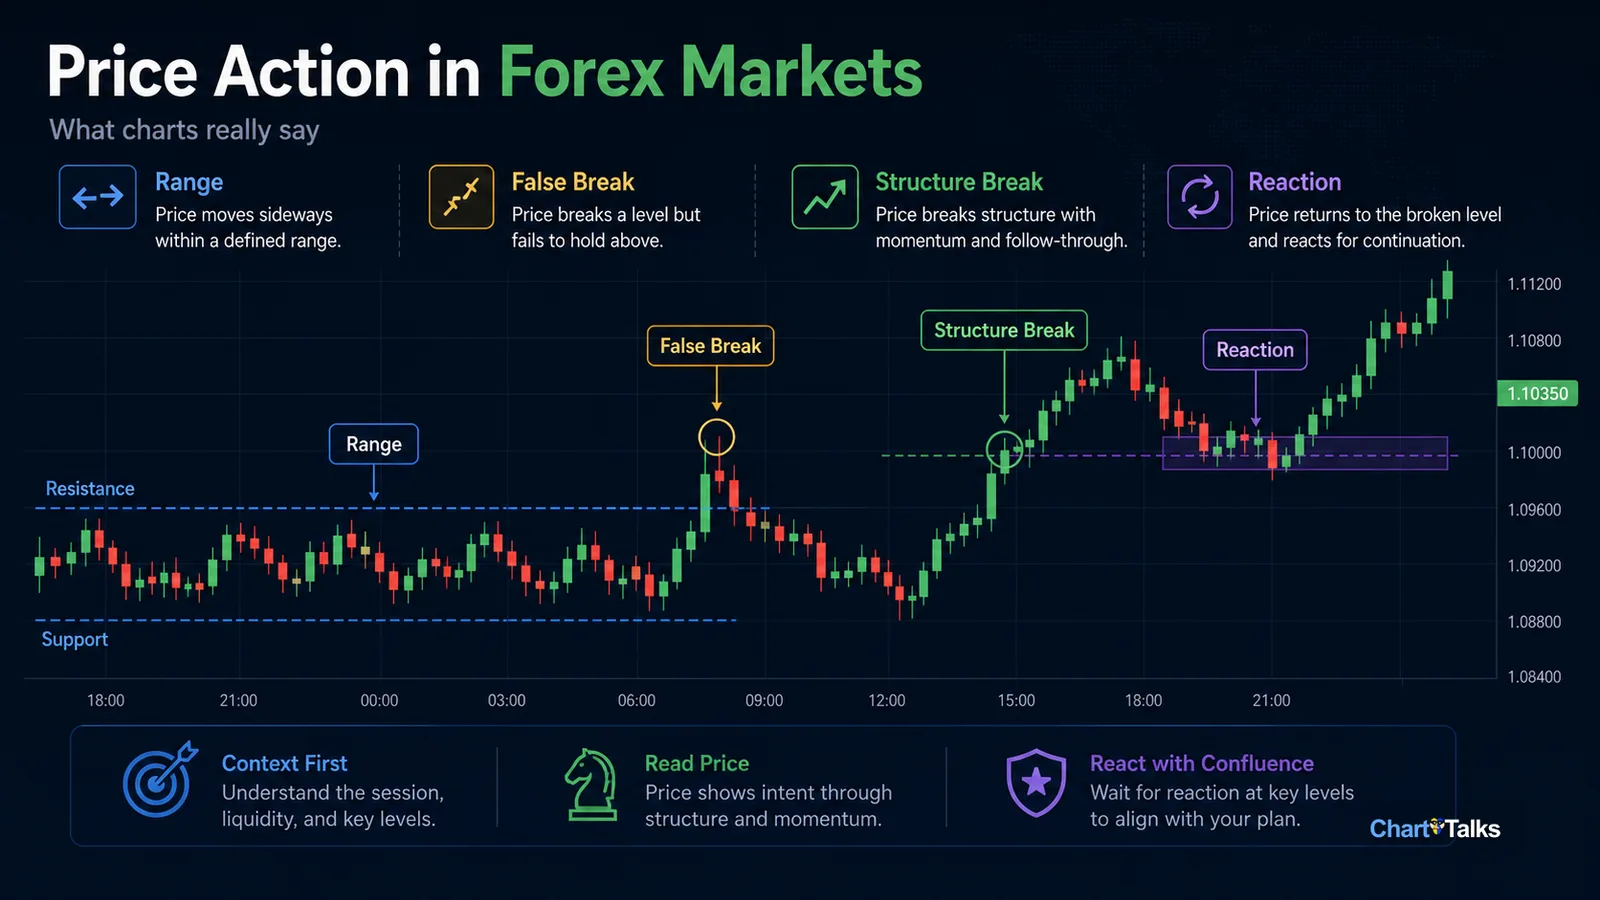
EUR/USD had been drifting sideways for hours. No news. No drama. Just candles moving back and forth inside a tight range.
I remember staring at the chart thinking, “This thing has to break soon.”
So I jumped in early. No confirmation. No structure break. No real reason beyond impatience.
Five minutes later, price spiked the other way, tagged my stop, and calmly returned back into the same range like nothing happened.
That moment taught me something important:
Price was already talking. I just was not listening.
That is where price action in Forex markets really starts. Not with indicators. Not with prediction. It starts with learning how price behaves when nothing obvious seems to be happening.
What Price Action Really Means in Forex
Price action is not a single strategy.
It is a way of reading the market.
When you strip a forex chart down to raw candles, you are left with buyers and sellers making decisions in real time.
Every candle gives clues about:
Who tried to take control
Who failed
Where traders were comfortable
Where traders panicked
Where liquidity may be resting
In forex, this matters because the market runs almost continuously through the working week, sessions overlap, and liquidity changes throughout the day.
Price action helps you adapt instead of predict.
You are not asking, “What will price definitely do next?”
You are asking, “What is price showing me right now?”
Why Indicators Often Confuse Forex Traders
Most beginners start with indicators.
RSI. MACD. Moving averages. Maybe a few bands, a few colored signals, and eventually a chart that looks more like a dashboard than a market.
At first, indicators feel safe. It feels like the tool is making the decision for you.
But in forex, that comfort can become a problem.
Indicators can confuse traders because:
Many indicators lag behind price
Forex can move quickly during active sessions
Ranging markets create false signals
Too many indicators can create conflicting bias
Traders may wait for confirmation after the move has already happened
By the time an indicator confirms a shift, price may already be near the next reaction zone.
Price action in Forex markets works the other way around.
You read what price is doing now, not only what it did several candles ago.
That does not mean indicators are useless. Some traders use them well. But price should come first. Indicators should support the reading, not replace it.
Understanding Market Structure Through Price Action
Before thinking about entries, you need structure.
Structure answers simple questions:
Is the market trending or ranging?
Are highs being broken or respected?
Are lows holding or failing?
Where did price last react strongly?
Is price moving with momentum or hesitation?
Without structure, a trader is only reacting to candles.
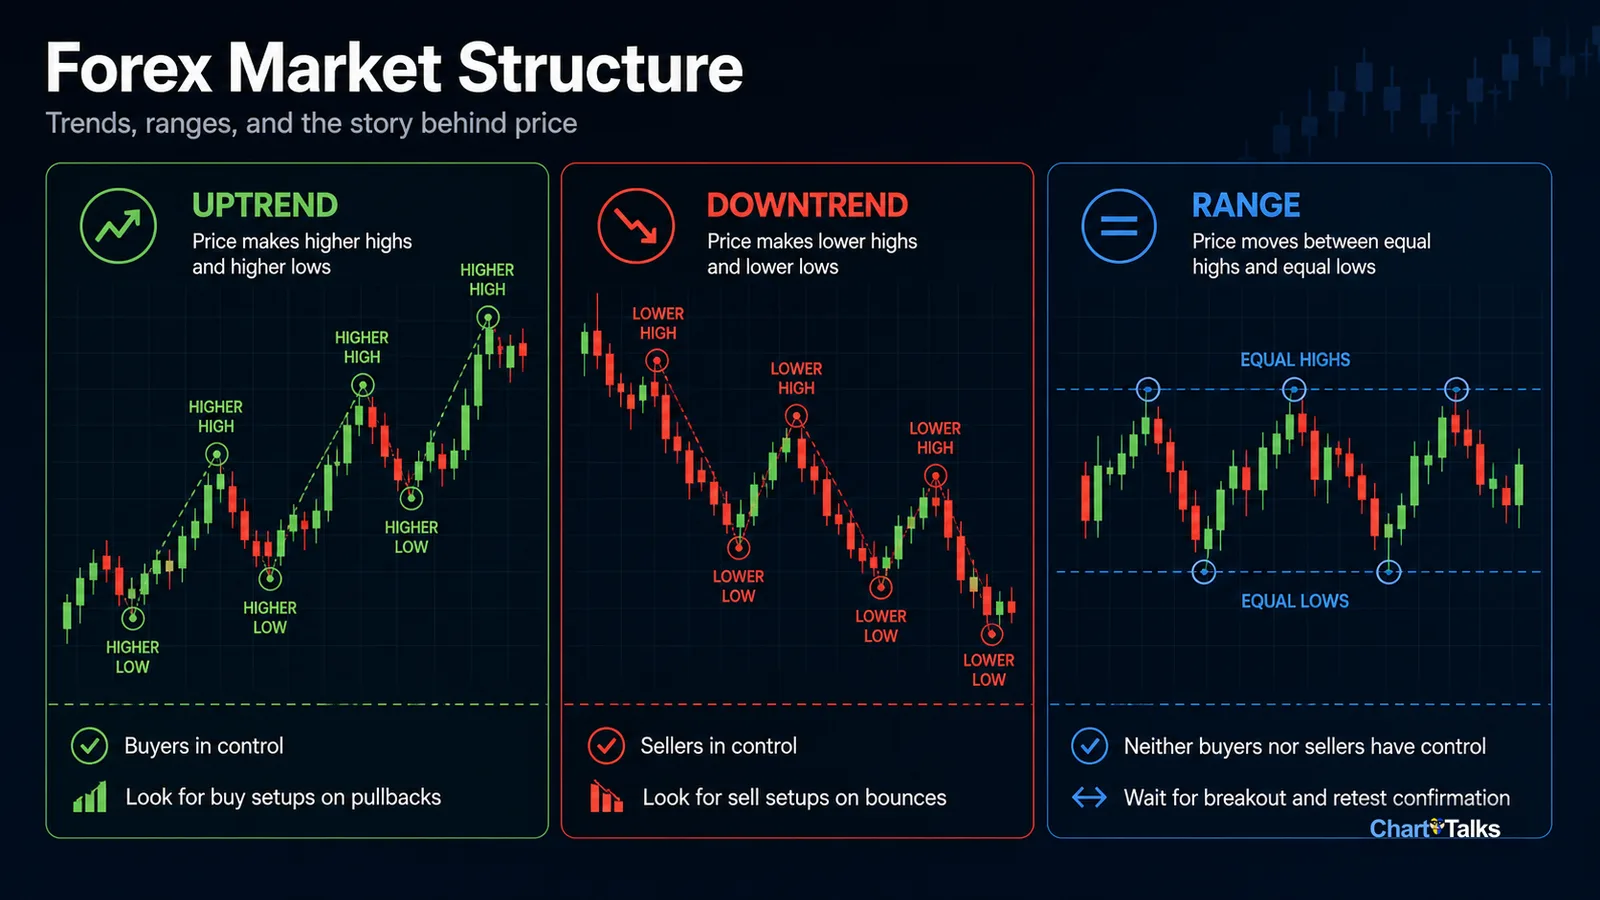
Higher Highs and Higher Lows
In an uptrend, buyers are generally in control.
Price makes higher highs and higher lows. Pullbacks matter because they show whether buyers are willing to defend structure.
In this environment, traders often focus less on chasing breakouts and more on waiting for pullbacks into logical reaction zones.
Lower Highs and Lower Lows
In a downtrend, sellers dominate.
Price makes lower highs and lower lows. Rallies may become selling opportunities if they fail at resistance or previous structure.
The key is not simply that price is falling. The key is whether each bounce fails to reclaim important levels.
Equal Highs and Equal Lows
Equal highs and equal lows often suggest a range.
Ranges show indecision. Price moves between boundaries, and false breakouts become common.
Many forex losses happen because traders treat ranges like trends or trends like ranges.
Price action keeps you honest. It forces you to ask what type of market you are actually trading.
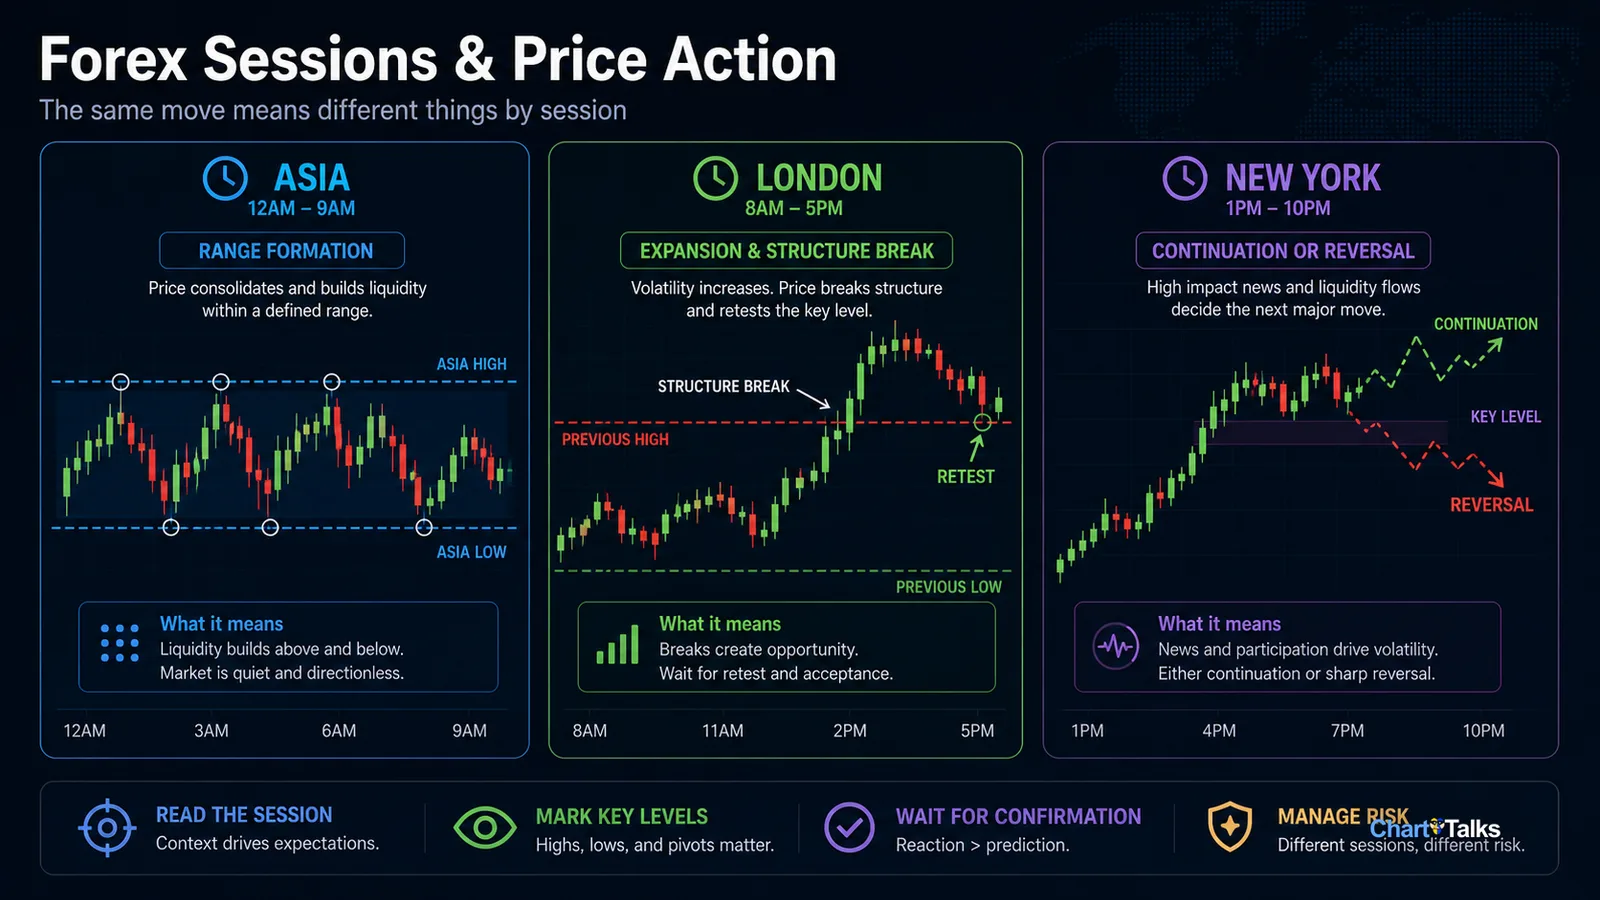
The Role of Forex Sessions in Price Action
forex session trading behavior
Price does not behave the same way all day.
The session matters.
A breakout during the Asian session does not carry the same meaning as a breakout during London. A New York move after major news does not behave like a quiet mid-session drift.
Asian Session
The Asian session often shows:
Lower volatility
Range formation
Thinner liquidity
Respect for nearby levels
False breaks around range extremes
This does not mean Asia is useless. It often builds the range that later sessions react to.
London Session
London often brings:
Stronger directional movement
Structure breaks
Liquidity sweeps
Early stop hunts
Expansion from Asian ranges
When studying price action in Forex markets, London matters because it often reveals intent after a quieter session has built liquidity.
New York Session
New York can bring:
Continuation of London direction
Reversal after overextension
News reactions
Profit-taking
Increased volatility during overlap
The same candle pattern can mean different things depending on the active session.
Always ask:
Which session created this move?
Candles That Actually Matter
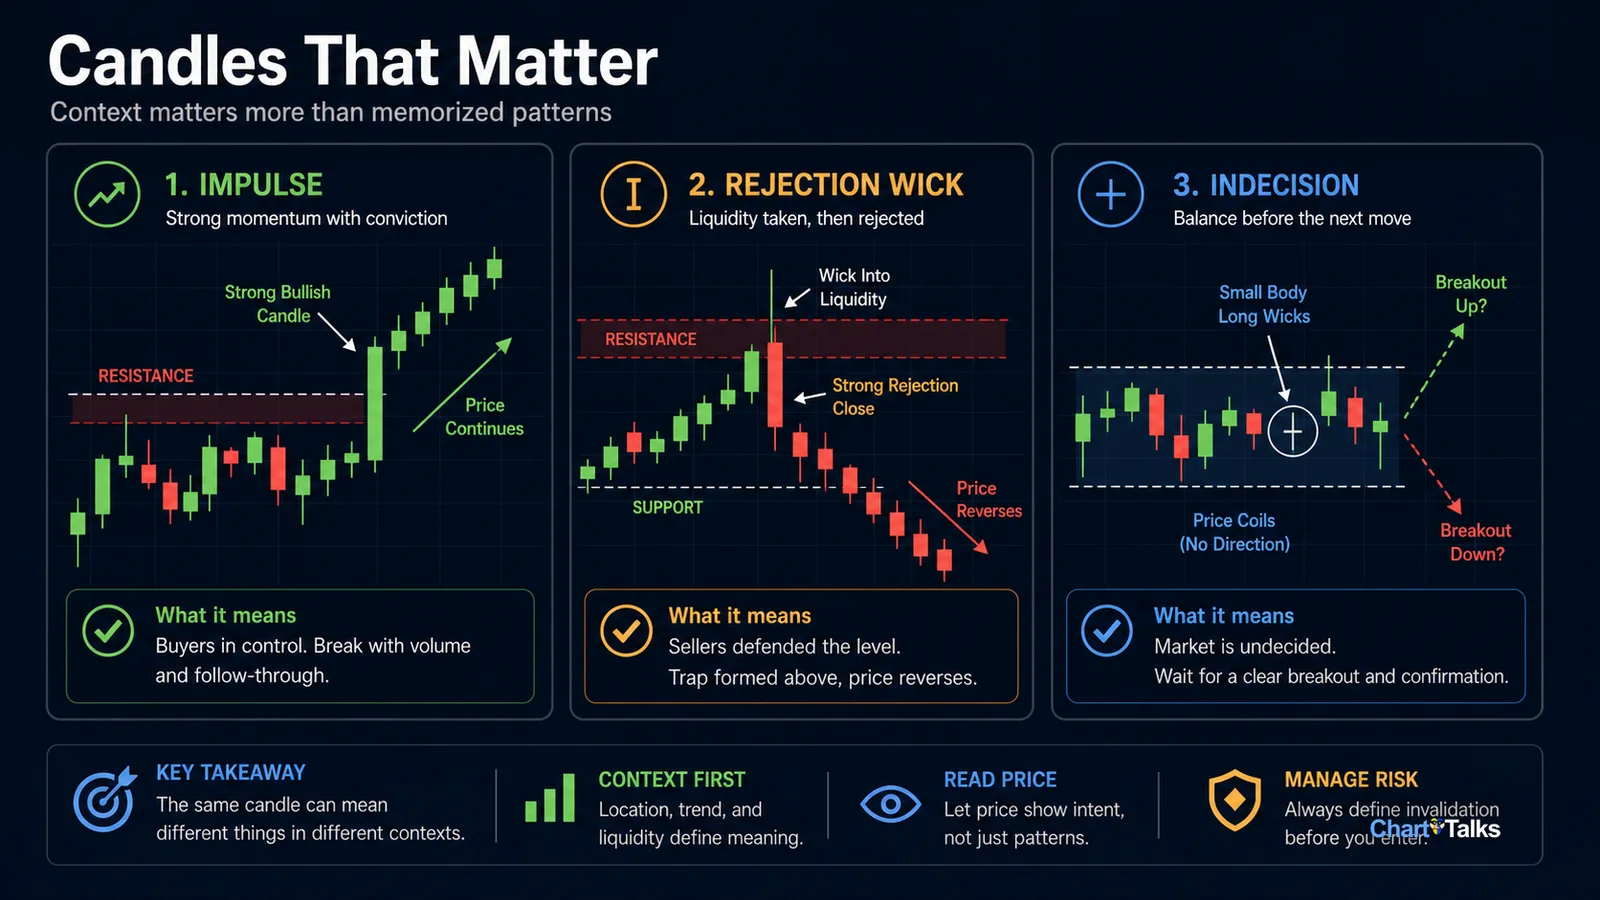
Not every candle deserves your attention.
A trader who reacts to every candle becomes exhausted. A trader who understands candle context becomes more selective.
Strong Impulsive Candles
Strong impulsive candles show commitment.
They suggest someone entered with size, especially when the candle breaks structure or leaves a previous range.
But even strong candles need context. A large candle into resistance is different from a large candle breaking into open space.
Rejection Wicks
Rejection wicks show failed intent.
Price tried to move into an area, found opposition, and snapped back.
A wick at a random place may not matter. A wick at a session high, previous day level, or key structure zone can matter a lot.
Small Indecision Candles
Small candles show hesitation.
They often appear before expansion, during pauses, or around important levels where buyers and sellers are temporarily balanced.
Do not memorize patterns without understanding why they formed.
A pin bar is not powerful because of its shape. It matters because of where it appears and what it rejects.
Support and Resistance Through a Price Action Lens
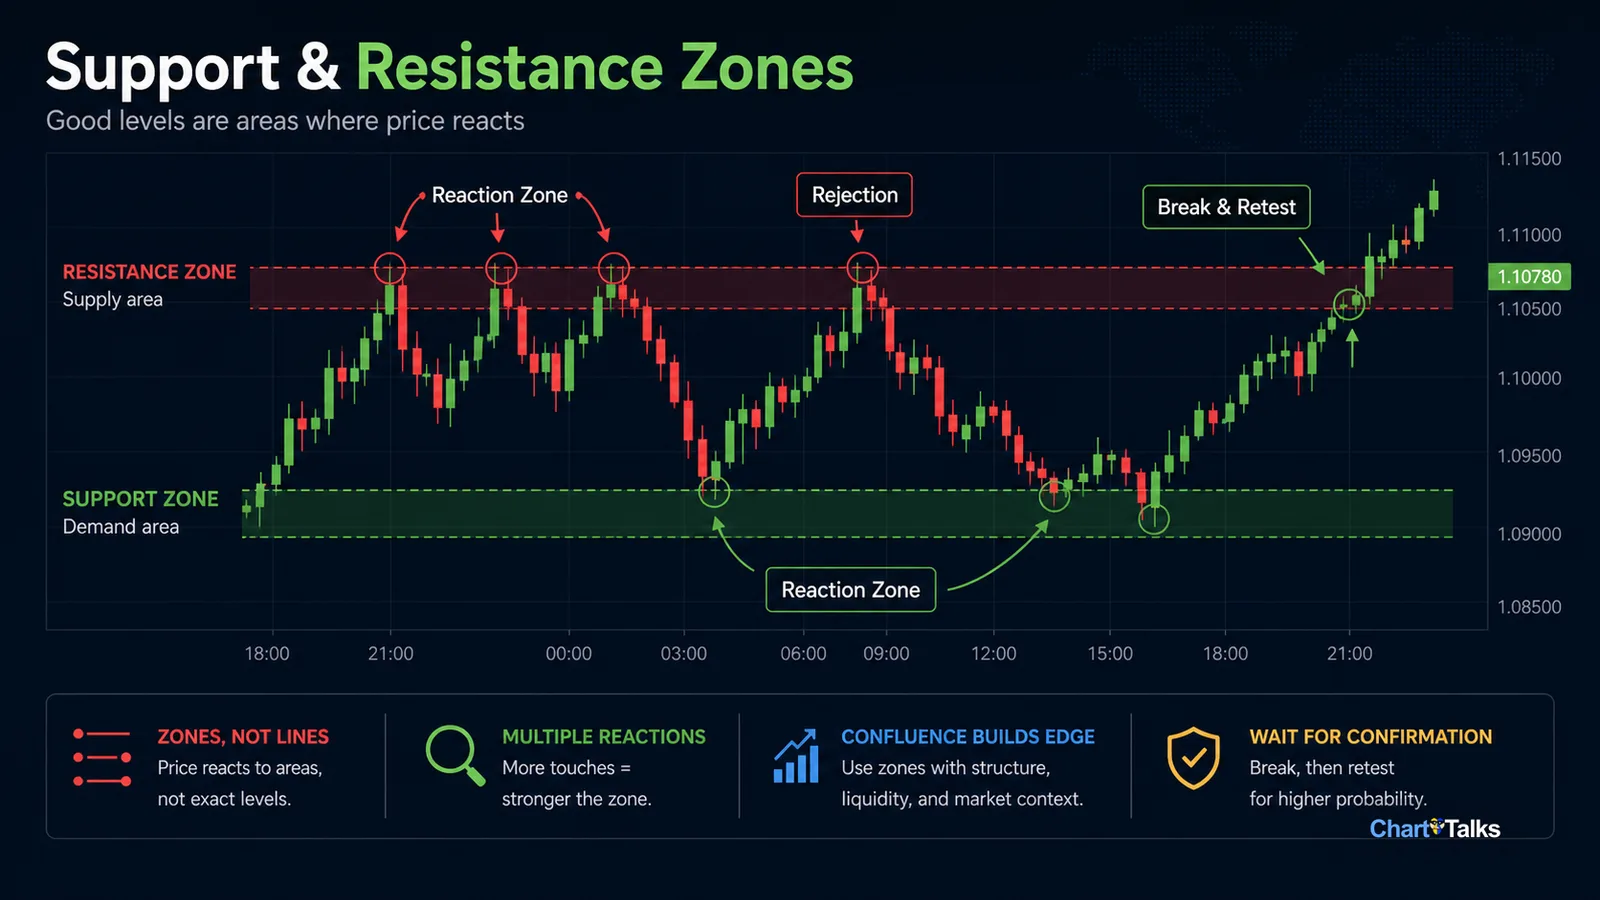
Forget drawing 50 lines.
More lines do not create more clarity.
Good support and resistance levels are usually:
Created by strong reactions
Aligned with previous highs or lows
Tested multiple times
Visible without forcing the chart
Connected to session highs, lows, or higher-timeframe structure
In forex, these levels often behave like zones, not exact prices.
Price action traders do not enter simply because price touches a level. They wait to see how price behaves there.
Does price reject?
Does it break and hold?
Does it sweep the level and return?
Does it stall without momentum?
That patience alone filters many bad trades.
A Practical Price Action Trading Framework for Forex
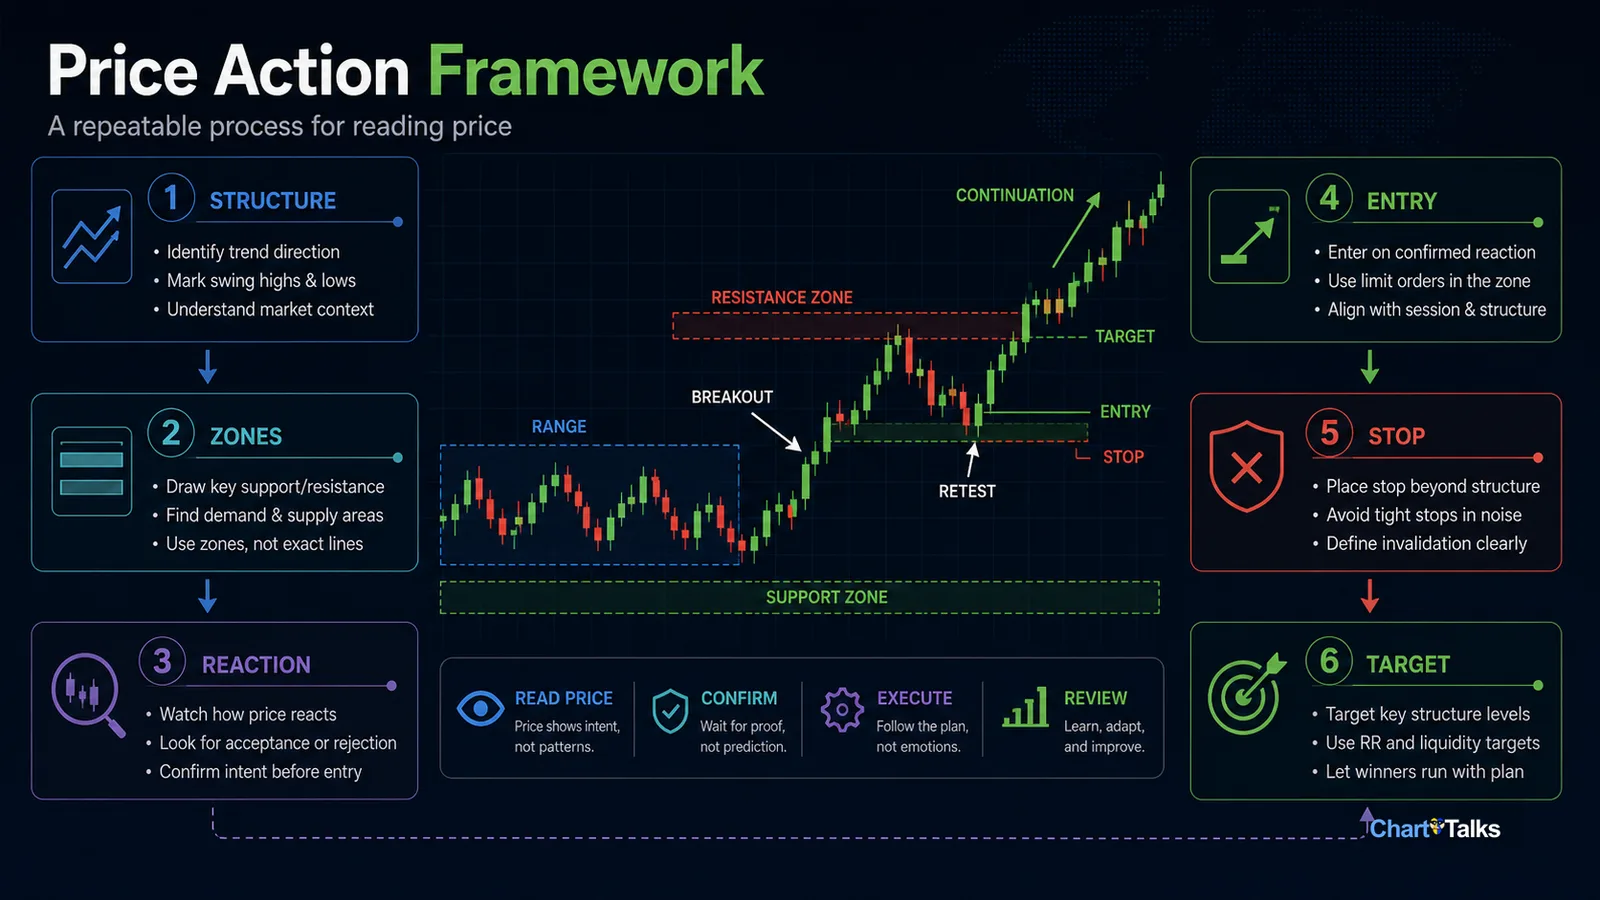
This framework works across timeframes, from M15 to Daily.
It is not a signal system. It is a reading process.
Step 1: Identify Structure
Ask:
Is price trending or ranging?
Where was the last strong move?
Are highs and lows being respected?
Is price near a major reaction zone?
If structure is not clear, do not force a trade.
Unclear structure usually creates unclear decisions.
Step 2: Mark Key Reaction Zones
Look for:
Previous highs and lows
Strong rejection areas
Session highs and lows
Range boundaries
Higher-timeframe levels
These are decision zones, not automatic entries.
The level tells you where to pay attention. Price reaction tells you whether to act.
Step 3: Wait for Price Reaction
This is where many traders rush.
You are watching for:
Rejection
Break and retest
Momentum shift
Failure to continue
Acceptance above or below a level
No reaction means no trade.
Waiting is not hesitation. It is part of the process.
Step 4: Build Entry Logic
Enter after price proves your idea.
For example:
In an uptrend, wait for a pullback and bullish reaction
In a downtrend, wait for a rally and bearish rejection
In a range, wait for rejection at extremes
After a breakout, wait to see whether price accepts beyond the level
You are not guessing.
You are responding.
Step 5: Place the Stop-Loss Logically
Your stop should go where the idea is invalidated.
Not at a random number of pips.
Not where the loss feels comfortable.
A logical stop usually sits beyond the structure that supports your trade idea.
If the stop is too wide for your risk plan, reduce position size. Do not squeeze the stop into noise just to make the trade feel affordable.
This article is for educational purposes only and is not financial advice. Forex trading involves risk, and losses can exceed expectations, especially when leverage is used. Always use a defined risk plan and understand the rules that apply in your country before trading forex or currency derivatives.
Step 6: Select Targets From Structure
Targets can come from:
Previous highs or lows
Range boundaries
Session extremes
Strong reaction zones
Structure projections
If price has no room to move, skip the trade.
A good entry into a bad location is still a bad trade.
Common Price Action Mistakes in Forex
These mistakes are common because they feel reasonable in the moment.
Overtrading Small Moves
Forex always moves, but not always cleanly.
A small move is not always an opportunity. Sometimes it is just noise between larger decisions.
Ignoring Higher-Timeframe Structure
A perfect M5 setup can fail inside a Daily range.
The lower timeframe shows detail. The higher timeframe shows where that detail sits.
Trading Every Candle Pattern
Not every pin bar, engulfing candle, or inside bar matters.
Candle patterns need location, structure, and timing.
Moving Stops Emotionally
Once you move a stop without logic, the structure no longer matters.
You are no longer trading price action. You are negotiating with discomfort.
Confusing Activity With Progress
More trades do not make someone a better trader.
Often, improvement begins when the trader starts taking fewer trades with better reasons.
Risk Management and Trader Mindset
Price action does not remove losses.
It helps control damage.
A clean chart will not save a trader who risks too much, moves stops emotionally, or treats one trade as a judgment of skill.
Useful mindset shifts include:
One trade means very little
Probability plays out over time
Capital is inventory
Missed trades are not personal failures
Waiting is a trading decision
In forex, survival beats aggression.
Good traders ask:
“How do I stay in the game?”
Not:
“How do I double this account quickly?”
Questions Traders Keep Debating on ChartTalks
You will see these discussions come up often:
Do you trust wick rejections more or structure breaks?
How do you adjust price action between London and New York?
Do you prefer clean charts or minimal indicators with price action?
How long did it take before price action clicked for you?
Which matters more: candle shape or location?
Different traders. Different views.
That is the value of shared charts and live discussion. The same EUR/USD move can look like a breakout to one trader and a liquidity sweep to another.
A Thought Before You Close the Chart
Price action in Forex markets is not something you master in a month.
One day, you may notice something has changed.
You are trading less.
Waiting more.
And stressing less about prediction.
That is usually when price action starts to become useful.
The chart is still forming.
It always is.
How Professionals Analyze Price Action
Professional traders do not treat price action as candle memorization.
They read the story behind the move:
Which session created the current structure?
Is price trending, ranging, or transitioning?
Where is liquidity likely resting?
What reaction would confirm the idea?
Where is the trade invalidated?
Does price have enough room to move?
That is the kind of thinking ChartTalks is built for. Share the setup you are watching, compare how other traders read the same structure, and study the difference between prediction and response.


